Saturday, November 23, 2013

Investigating The Position Of High Form Lights

My instructors at The Cambridge Street Studios explained to me, a process for identifying the high form light on a form by reverse engineering from the relationship of a highlight to the light source.  Footnotes are included in this post to indicate which sentences in this post are summarizations of ideas that the instructors at The Cambridge Street Studios have explained to me.

While it can be easy to identify the position of a highlight, because of its value contrast to the surrounding form, it can be difficult to determine the position of the highest form light on a form.
It is crucial to identify the high form light on a form.  All forms have one point that is faced most towards the angle of the light source, that point is the high form light, and all of the remaining planes on a form receive less light as they recede in space from the high form light.  It is only by representing this effect of light on form that one can clearly show a form's spatial orientation to a light source.

Even though high form lights may not appear to be as obvious as highlights, one can reverse engineer from the light source's position in relation to a viewer to determine the position of a high form light in relation to a highlight.¹  To do this, something must be known about highlights and high form lights.


Highlights on a form are visible halfway between the angle of light projected by a light source in single path known as a light ray, and the angle of that light ray's reflection into a viewer's eye.  High form lights are the point on a form that is most parallel to the angle of a light source.  Note, in this post I will use the term highlight to refer to the concentrated area of specular reflection on a form that is seen by a viewer.

Description of Highlights

Highlights are caused by specular reflection and highlights are essentially made up of specular reflections.  Specular reflection is the mirror-like reflection of light on a smooth glossy surface where the angle of incoming light projected in a single direction from the light source, the angle of incidence, is reflected at the same angle into a viewer's eye, the angle of reflection.  Therefore, the angle of incidence equals the angle of reflection.
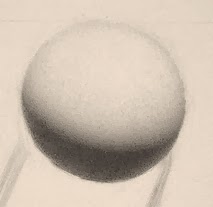
 An example of a specular reflection on a sphere.

 Many specular reflections cause the large highlight area on the sphere.

A useful analogy that I thought of to help visualize the effect of specular reflection is to imagine hitting a tennis ball on the ground.


The illustration above shows how the angle that the tennis ball is hit at is the same angle that it is reflected at, similar to how in specular reflection the angle of incidence is always the same angle as the angle of reflection.  This principle holds true no matter what angle the tennis ball is hit at.   If the tennis balls in this analogy were photons of light and the path that each tennis ball followed was a light ray then the specular reflection would occur where the light ray hits the surface of the ground, the halfway point between the angle of incidence and the angle of reflection.

Specular reflection is only visible at the halfway point between the angle of incidence and the angle of reflection into a viewer's eye.  A useful analogy that I thought of to help visualize this effect is to imagine you are standing on a tennis court, across from a giant tennis ball machine.  The tennis ball machine projects millions of tennis balls at one moment.  But, you will only be hit by the tennis balls that are in your line of sight.


The point where the tennis balls in your line of sight hit the ground would be the halfway point between the angle of incidence and the angle of reflection into your eye.  If the tennis ball machine in this analogy was a light source, the tennis balls were photons of light, the path that each tennis ball followed was a light ray and the ground was the surface of a form then the specular reflection would be seen at the point where the tennis balls in your line of sight hit the ground (the halfway point between the angle of incidence and the angle of reflection into your eye).  The blue circles on the ground in the above illustration show the area where the specular reflection would be seen for light ray A and light ray B.  The area between where both of these light rays hit the ground is so close that the blue circles are touching.  The grouping of the two blue areas where specular reflection would be seen by the viewer is the same as how specular reflections group together to show a brighter and larger highlight area.  The viewer in this highlight analogy would be hit by different tennis balls in their line of sight depending on where they were located on the tennis court and the area where those tennis balls hit the ground, the area where a highlight would be seen, would change as the viewer moved.

The same principles that apply to the tennis ball analogy are present while viewing a highlight in real life.  

Viewing Highlights

Because highlights are visible when the angle of incidence equals its angle of reflection into a viewer's eye, the highlight shares the same relationship to the high form light as the relationship of a viewer's position to a light source.¹


By knowing one's position in relation to the center of a light source, one can identify where the high form light is in relation to the center of a highlight.¹  The diagram above shows how the position of the viewer in relation to the light correlates to the position of the high form light in relation to a highlight.  For example, the light is very far to the right of viewer A, so the high form light, outlined in red, is very far to the right of the highlight that viewer A sees.  Also, the light is closer to the left of viewer B, so the high form light is closer to the left of the highlight that viewer B sees.


Additionally, the location of the high form light in relation to a highlight changes vertically with a viewer's relation to a light source.¹  In the diagram above, the light is above and to the right of the viewer, so the high form light, outlined in red, is above and to the right of the highlight.  It should be noted that although the relationship of the highlight to the high form light generally correlates to the relation of the viewer to the light source, that distance can not be pinned down to a measurable distance.  For example, just because a viewer is 5 feet to the left of the light does not mean that the highlight is 5 feet to the left of the high form light.  But the distance of the highlight in relation to the high form light will generally correlate to the distance of the viewer in relation to the light source.


Footnotes
¹ Jeremy Deck, personal communication, 2013.

Sunday, November 17, 2013

A Theory On Representing A Local Color


Although one has to deal with a limited value range while drawing on paper, there are ways to manipulate the medium of graphite to better represent an objects' local color.  My instructor, Jeremy Deck, has recently informed me of a way to represent an object's local color with the limited medium of graphite.  This post is an explanation of my understanding of that process.  Footnotes are included in this post to indicate which sentences in this post are summarizations of ideas that Jeremy Deck has explained to me.

By specifying three modeling factors I have been able to better represent the local color of the forms that I see.  These factors include, the value of the highest form light, the distance of the halftone before the terminator and the value of the shadow.¹

 The example above (on the left), represents a sphere with a white local color under much light.  The high form light has been set at white of the paper, the shadow value has been set at a visual average of the shadow value observed and the small distance of the halftone has been pushed very close to the terminator.  By making the distance of the halftone small and very close to the terminator, the drawing seems to represent a light local color under a lot of light.¹
The example above (on the right), represents a sphere with a slightly grey local color under a decent amount of light.  The high form light has been set at white of the paper and the shadow value is also set at a visual average.  The only difference in the modeling factors between this sphere and the one on the left is that the distance of the halftone before the terminator is slightly larger. According to Jeremy Deck, the smaller the distance of the halftone before the terminator, the more a drawing represents a form with a lighter local color under much light.¹  I imagine, and it would depend on the situation, that the darker a local color to be represented the more the value of the high form light would have to darken from white of the paper.

In conclusion, I am not prescribing a formula for representing the local color of objects, this is only one of many ways to represent the local color of an object in graphite.  Rather, I am just sharing how this process has allowed me to better represent the local color of the objects that I draw.  I would like to know how the science of how the eye percieves light can inform one's process for representing the local color of an object as well.  If anyone is willing to share information on this topic with me please let me know.

*Blog Note- Some of you may have noticed that the information in this post has changed from its original post on 11/17/13.  I have found that my explanation did not follow the laws of physics and had to update it.  I apologize for the incorrect information in the original post.  I am still trying to comprehend how the eye processes light and how that effects the way a local color is perceived.  As well as a better way to represent the local color of the forms I draw.  If anyone would like to share some insight with me please let me know.


Footnotes
¹ Jeremy Deck, personal communication, 2013.

Saturday, November 9, 2013

Determining Distances

     Drawing is guided by an understanding of what it is that one is seeing.  Even though simplifying the vague shapes on a subject into animal shapes is helpful, point to point measurement provides additional clarity to the character of the shapes that one sees.  By gauging the distances on, across and within shapes one can better judge the accuracy of the shapes that one is drawing.  There are five types of point to point measurement that I have been learning about at The Cambridge Street Studios and they include, percentage measurement, internal measurement, contour measurement, directional measurement and triangulation.  Please note that besides triangulation, I have come up with my own terms to classify these processes due to an unawareness of any official terms to describe them.  Footnotes are included in this post to indicate which sentences in this post are summarizations of ideas that the instructors at The Cambridge Street Studios have explained to me.
   
     Percentage measurement proceeds by determining the distances on a shape by simplifying its sections into percentages.¹  I first learned of percentage measurement from my instructor, Jeremy Deck, a few months ago.


     In the image above the right side of the shape has been divided into two percentages.  By seeing more specifically how the two segments of the shape appear I can better judge the accuracy of that shape.
     
     Internal measurement is focused on determining the distances within a shape by moving from point to point within a shape.

     Point to point measurement can be applied to the spaces within a shape as well as the spaces within a mass of shapes.  Although much point to point measurement is done just by scanning one's eyes over the subject and the drawing simultaneously, one can trace these imaginary lines in the air for additional clarity of the point to point measurement.

     Contour measurement proceeds by moving from point to point along the contour of a shape to check the accuracy of the segments of a shape.

     It is helpful to think of contour measurement as moving along the segments of an animal shape to see if the line segments in one's drawing correlate to the character of the animal shape that one sees.  Point to point measurement is just a tool to represent the character of the shapes that one sees, and I have found it very important to only use it as a tool.  It has been crucial for me to verify the findings that point to point measurement show me by checking it to the animal shape(s) that I see.

     Directional measurement proceeds by counting the spaces within a shape along a straight directional path.  

     The example above shows the points where one's eye would stop along the directional path.  Any directional path can be used to check points across a mass of shapes whether it be horizontal, vertical or diagonal.

     Triangulation proceeds by selecting three points on a shape and determining the size of the triangle that the three points produce.

     It is very helpful to think of the triangle produced by triangulation as a slice of pizza because one's relation to the idea of the size of a slice of pizza makes it easier to compare the size of the triangle on one's drawing to the size of the triangle that one sees on the subject.

     All five ways of point to point measurement were very helpful to me while I was drawing the block-in shown below.


Footnotes
¹ Jeremy Deck, personal communication, 2013.